Related sites:
Newsletter: Perspectives on Power Platform
Company: Niiranen Advisory Oy
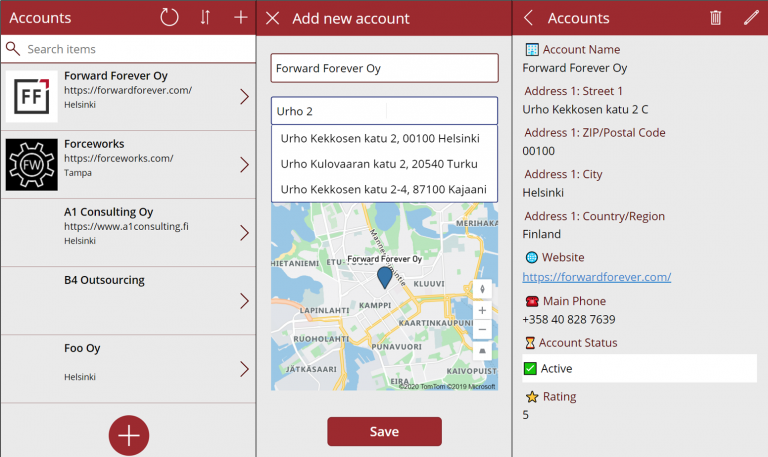
Using the new geospatial controls in Canvas apps to combine Azure Maps features with customer address data from Dataverse.
In addition to standard color picker options, Power Apps also supports CSS color names to define the appearance of text and icons. To make these color names work in conjunction with our custom SVG icon library from the previous blog post, let's also build a custom color picker for grouping and visualizing the available colors inside Canvas apps.
To create high quality visualizations for apps that can both scale to high resolutions as well as be dynamically manipulated via formulas, Scalable Vector Graphics (SVG) would be a great choice for Canvas Apps. While there is no native support for SVG features in Power Apps, you can bring in their XML definition and work with it to create a gallery to browse a complete library of icons imported from open source repositories like GitHub.
Dynamics CRM is a great tool for making your business processes more quantifiable. Sure, you can maintain a list of your open sales opportunities in an Excel sheet and plan your customer meetings with your Outlook calendar, as many organizations…
“We’ve got charts and dashboards!” Yes, ok, so that’s the common initial reaction to one of the most visible new features of Microsoft Dynamics CRM 2011. After playing around with the OOB charts in CRM 2011 Beta and building a…