Related sites:
Newsletter: Perspectives on Power Platform
Company: Niiranen Advisory Oy
To create high quality visualizations for apps that can both scale to high resolutions as well as be dynamically manipulated via formulas, Scalable Vector Graphics (SVG) would be a great choice for Canvas Apps. While there is no native support for SVG features in Power Apps, you can bring in their XML definition and work with it to create a gallery to browse a complete library of icons imported from open source repositories like GitHub.
When creating business applications on Microsoft Power Platform, a major difference between the traditional “CRM style” Model-driven apps and the modern “mobile first” Canvas apps is the possibility of visualizing data and available features in the app. Yes, having well-structured data to begin with is of course a fundamental requirement of being able to construct a meaningful business app. The freedom of pixel perfect visuals that Power Apps can deliver in the Canvas style apps is, however, an important factor when it comes to the perceived value that the end users can get from accessing the app.
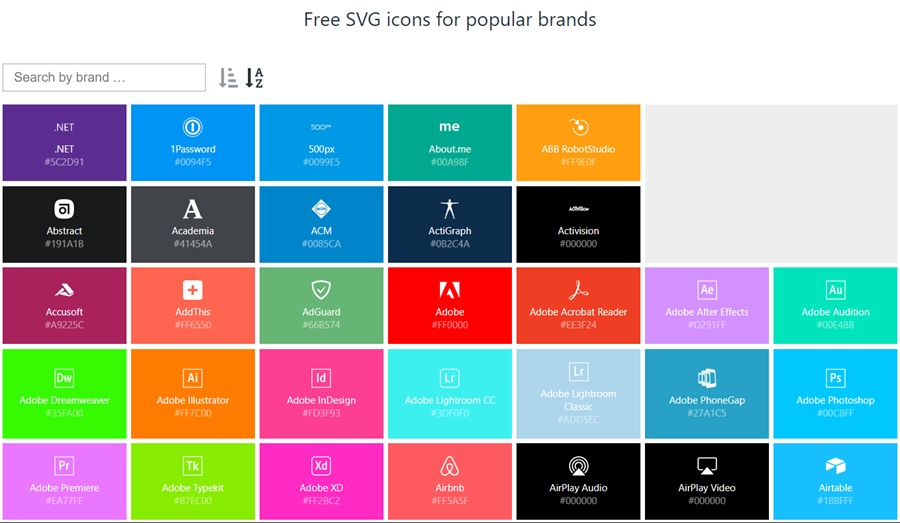
If you’re willing to spend time in generating static images for all the different areas of your app UI and, more importantly, to reflect the state of your app in relation to the data that the user is viewing, then the sky’s the limit for what you could achieve with Power Apps. Now, considering that these low-code/no-code tools aren’t exactly targeted for professional app development teams that would have designers equipped with the tools & skills to create amazing graphics on demand, we often need to explore more frugal ways to make the app visuals serve their purpose. For those of us with next to zero skills in graphic design, sources of free / open source digital illustrations like IconFinder are like a gift from above. There are also a number of awesome icon libraries available on GitHub. Here’s an example of Simple Icons:
Static graphics like PNG files can already do wonders to your Power App UI, but wouldn’t it be nice if you could also leverage the more scalable and adaptable SVG’s (Scalable Vector Graphics)? Especially for monochrome line drawings like the ones you’ll see a lot in today’s flat app UI, an SVG with transparent background and also a configurable color would be highly useful. Unfortunately, Power Apps today doesn’t support SVG file manipulation when imported as images. There’s a built-in set of icons that come with the Maker studio, which most probably are vector graphics, but you cannot add your own icons into that list. What this means is that if you import an SVG image into your app, there’s not going to be any more parameters available for you to adjust than if you had brought in a JPEG. Doh!
A Canvas app that I’m currently building requires a large number of icons that should be dynamically changed based on a variable. For the purpose of mapping the suitable icon with a specific value and testing the UI, I wanted to bring in a whole library of icons and play around with it in Power Apps Maker Studio. In order to have better control over the icon appearance, I wanted to be able to modify the actual XML definition that makes up the SVG icon. Here are the steps how I managed to get the data inside the app and also how to render the SVG icons from the XML that I dynamically modify with formulas.
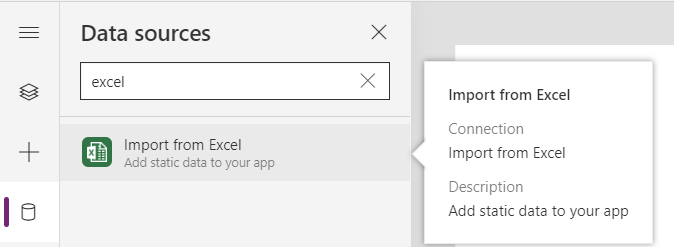
Excel is a data source in Power Apps that allows you to import a static table of data into the app and store it there for all the app users to consume, without having to work with connections to external data sources. This type of resource file was quite convenient for my purposes, so the first thing I had to figure out was how to get a folder full of SVG files imported into an Excel table where each icon’s definition is represented on one row. In the above example of Simple Icon library, this would be the contents of the folder “\simple-icons-develop\icons”.
Power Query in Excel has the “From Folder” option available when using “Get Data / From File”, which brings in not just a single file but rather all the files inside a specific folder. Great, that’s what I needed! Oh, but the source files I have are SVG which Excel doesn’t understand. No problem, let’s just change the file type to XML by renaming the files with by running this in the Command Prompt after navigating to that folder:
ren *.svg *.xmlThis is what we should now have:
Now we’re ready to consume the folder contents in Excel. Using “From Folder” and selecting “Transform Data” in the import prompt, we see a view like this:
A good start, but we need to do some transformations to this data. First, in the Content column, click on the two downward arrows for “Combine Files” and see the results:
Awesome, now we’re actually inside the XML file structure! What we’re really after is the <path> element in SVG , which is the ultimate drawing that creates the lines, curves and shapes. We don’t have to understand anything about its syntax (well, at least I don’t) but we need this data to get Power Apps to render the SVG shape inside an image control. Since it’s currently a table in the Power Query Editor, we click on the two parting arrows to expand its contents, which consists of a single attribute called “d”.
We’ve now got everything we need, so the last steps are in removing unnecessary columns and renaming the existing ones. The first three ones are what we want to save into our Excel table, so let’s simplify the column names to “name”, “title” and “path”, then click Close & Load. You should have a beautiful Excel file with as many rows as you had files in the source folder. Before saving and closing the .xlsx, give the table a sensible name that you want to have showing up as the data source name in Power Apps.
How does one actually turn the XML definition data into a visible image in Power Apps? There’s a great blog post from Laura GB titled PowerApps – SVG Introduction, which gives us all the details needed to make the Image control render our SVG data. To see how it works in practice, let’s first bring in our Simple Icons Excel table into Power Apps as a data source:
Next we can add a horizontal gallery onto our screen an choose to use the imported table “icons” as our data source:
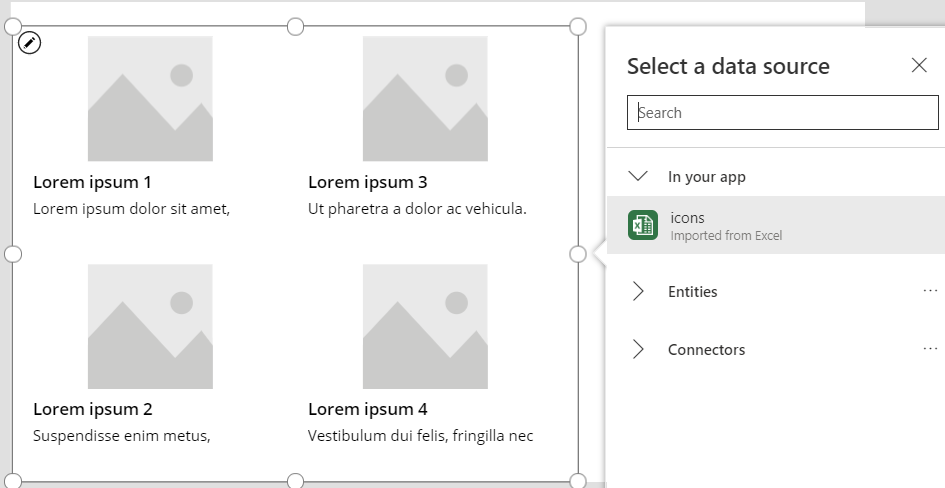
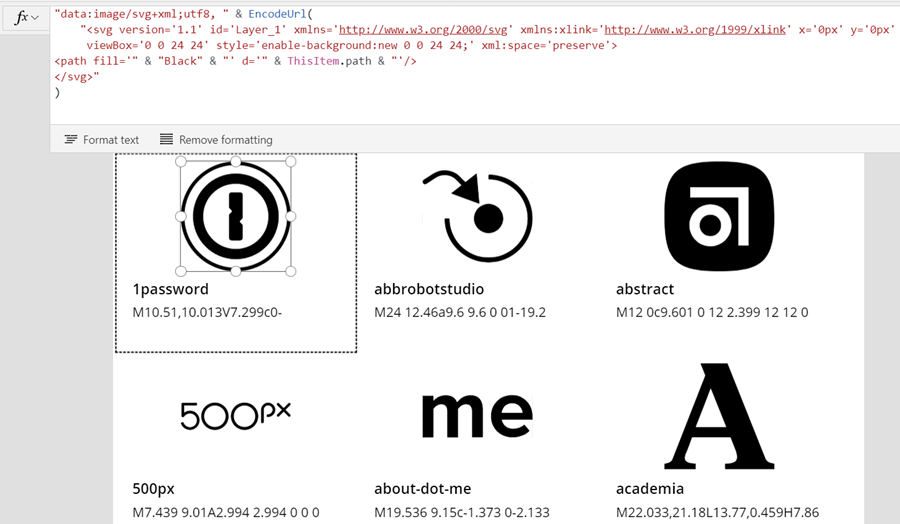
Our table has the three columns we left in there when working with Power Query. From the default mapping we can see that the gallery item’s Subtitle1 label has “ThisItem.path” as the Text value. This is the data we’ll want to use in the image control of the gallery item, but first we’ll need to wrap it into something that gives Power Apps the context around it needed to render the SVG image, since we only imported the one attribute and not the complete XML. However, since this XML part will be exactly the same for any icons that we want to display from this Excel table, it can consist of static text, inside which we’ll inject a few dynamic values with the Power Apps formulas. Adapted from Laura’s post, this is how the Image property of the Image control inside the Gallery item should look like:
"data:image/svg+xml;utf8, " & EncodeUrl(
    "<svg version='1.1' id='Layer_1' xmlns='http://www.w3.org/2000/svg' xmlns:xlink='http://www.w3.org/1999/xlink' x='0px' y='0px'
	 viewBox='0 0 24 24' style='enable-background:new 0 0 24 24;' xml:space='preserve'>
<path fill='" & "Black" & "' d='" & ThisItem.path & "'/>
</svg>"
)
The important part is how we construct the “d” attribute from ThisItem.path on line 4, as that will be the only dynamic value in our SVG for now. Here’s what the result will look like:
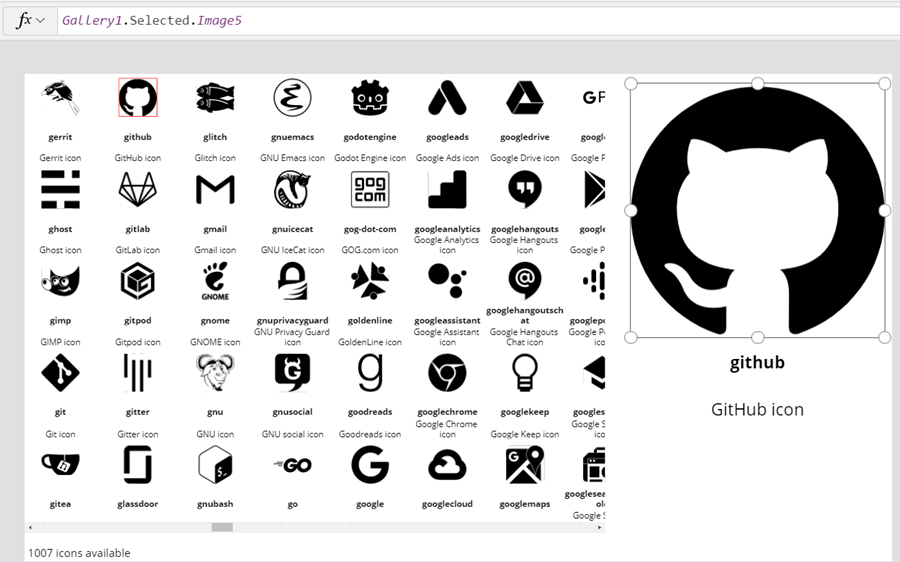
It works! We can now design a gallery that will allow us to conveniently browser through the complete collection of 1007 icons in the library, by having a live “thumbnail” of the icon in a smaller 100*100 image control. To then view the selected icon in a larger format, let’s add a new image control outside the gallery and set it’s Image property to reference the Image of the selected item from Gallery1. Since these are vector graphics, there should be no loss of quality, no matter how large we set the image size to be:
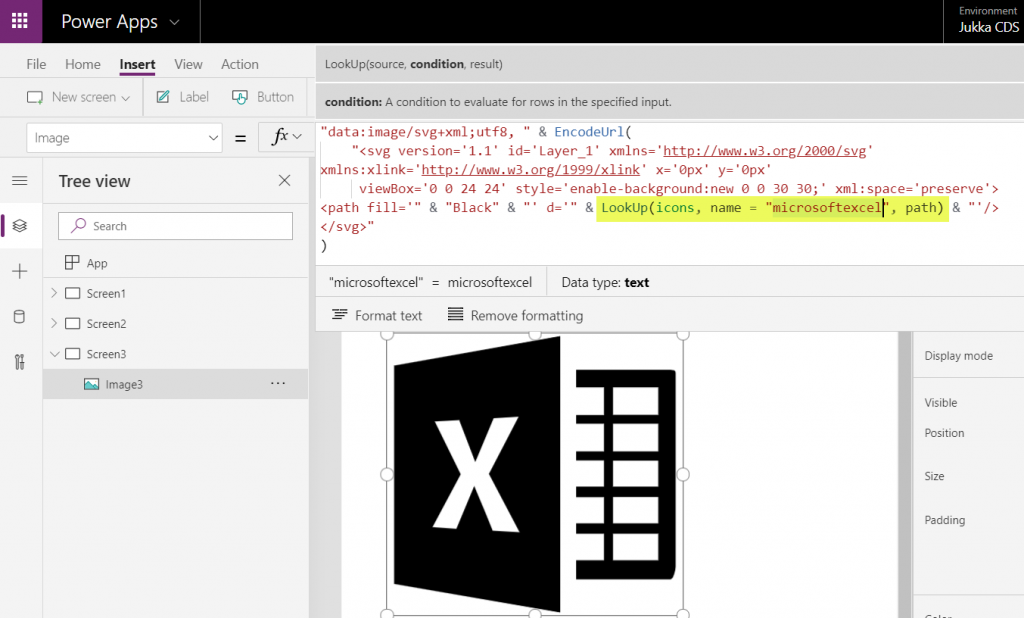
If we now want to use these imported SVG icons from anywhere else in our app, we can just do a LookUp to the data source with the icon name and return its path, like this:
LookUp(icons, name = "microsoftexcel", path)Using this when wrapped within the same formula we used earlier for showing the gallery’s selected item’s path will now give us a rendering of the SVG icon that matches our LookUp function:
“Hmm, wont this kind of library of a thousand icons make our app size huge?” Not really. Since we are only storing the shapes instead of the pixels, the payload will actually be very compact for each icon. In this example with the Simple Icons library, here’s how much storage the different parts consumed:
By taking just what we need (the shape information) and leaving out the static XML file’s overhead we’ve actually managed to shrink the 1007 icons into a much smaller space with our Power App. The other benefit is that further adjustment like icon color can now be set in our own formulas. In a follow-up post I’ll continue adding features into this icon library browser app to make use of exactly this capability.

Beautiful Jukka, I will use this straightaway if you don’t mind 🙂
[…] my previous post we took the contents of an open source SVG icon library from GitHub and imported that into a Canvas […]
[…] designers uses them own icons instead. But you can use any svg icons in your Power App. Read Jukka’s post about how to do […]
Hey, Can we change the Color of the icons?
Yes, please see my post on Using CSS color names for SVG icons in Power Apps Canvas app.