Related sites:
Newsletter: Perspectives on Power Platform
Company: Niiranen Advisory Oy
 There are some great new features available in Excel 2013 that can take your Dynamics CRM data visualization onto a whole new level without the need to invest in new server infrastructure or build traditional OLAP cubes on your SQL Server. With the recent announcement of the GeoFlow Preview for Excel 2013, I decided to see what I could make of this tool when combined with some data pulled from CRM.
Although the feature parity of CRM Online and Dynamics CRM on-premises is on quite a high level these days in terms of the application platform capabilities, one unfortunate limitation has been that you can’t easily tap into the CRM Online data with analytical applications like Excel PowerPivot. Naturally the direct SQL database table connection is unavailable, but also the OData feeds that would be such a neat way for performing some pivot magic have been off limits, as PowerPivot doesn’t support the claims based authentication of CRM Online. Oh, and as far as I know, this also applies to an IFD configured on-premises server (if anyone knows how to connect to the OData feed with AD authentication while using an IFD CRM, do leave a comment below).
With the new capabilities of Excel 2013, there is now a workaround available that allows you to access OData feeds from CRM that require Windows Live ID / Microsoft Account / Office 365 authentication. You’ll also need the CRM Outlook client on your workstation to facilitate the initial connection, although with another workaround for the sign-in prompt on the Excel sheet you might be able to do without one.
Here’s a great video from former Dynamics CRM Team member Ed Martinez that walks you through the steps needed in order to connect your Excel 2013 (note: Excel 2010 is not supported AFAIK) to a Dynamics CRM Online OData feed:
(For all the Finnish speaking CRM folks out there, you can also check out this video clip by Sulava’s Markku Suominen.)
As a summary, what you need to do is:
That’s it. Now you can connect an Excel sheet to a CRM Online (or IFD) data source through OData and refresh the content to reflect the live data as your CRM source system gets updated.
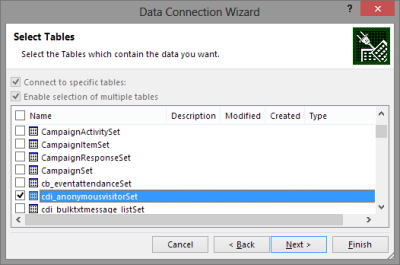
For my own lil’ “Big Data” scenario I decided to point my OData enabled Excel 2013 towards a Dynamics CRM instance where ClickDimensions is storing the website visitor data from this blog (sorry, you’re being tracked, but it’s all for a noble cause, trust me). I proceeded by following the instructions above, adding a new OData data source into a dynamic Excel sheet, selecting the entities (“sets”) that I wanted to use in my analysis. Then I waited… and waited… and waited some more.
A word of warning: OData data feeds can be slow. It’s nothing like using a direct database connection, and not even the type of performance you get with a dynamic Excel in an IFD environment that uses an Excel Web Query to “screen scrape” the data over http. My data set was retrieving around 100,000 records and I saw the counter ticking on the bottom right corner of the Excel sheet at a rate of roughly 200 rows per second, which translates into some 10 minutes of waiting before the download from CRM is complete. Oh well, it’s not like we’re in a rush to create a real life report for the boss who wants to have it in his inbox within 15 minutes. Let’s be grateful that we can at least retrieve more rows in one go than the default MaxRecordsForExportToExcel setting for this CRM organization would otherwise allow (which is 10,000).
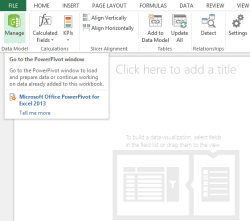 After we’ve managed to download the data, we can proceed to either directly drop the columns onto the Power View report canvas or we can go ahead and open the PowerPivot window from the Manage Data Model button on the ribbon. Since this isn’t traditional Excel Pivot but PowerPivot, things like date value grouping by year/month should be added manually into the data set as new columns by using formulas instead of just right-clicking on the date fields (this is the way Power users like it, I guess). We could also add a whole bunch of intelligence DAX functions into our source data tables, but since I actually wanted to see how the data looks when laid over a GeoFlow map, I’ll save that excitement for some other quiet evening of quality time with my CRM, Excel and a wee dram of a fine single malt.
The great thing about Power View as well as GeoFlow is that they can identify geographic variables directly from the source data text fields on both country and city level. You could also feed them the detailed longitude and latitude values, but it’s far more likely that your business data will contain human readable address fields. You can simply state that this field contains city names and the application will do its best to match the values with its global address database. You won’t get 100% accuracy with such methods of course but when dealing with large data sets and ad-hoc analysis this is hardly a show stopper.
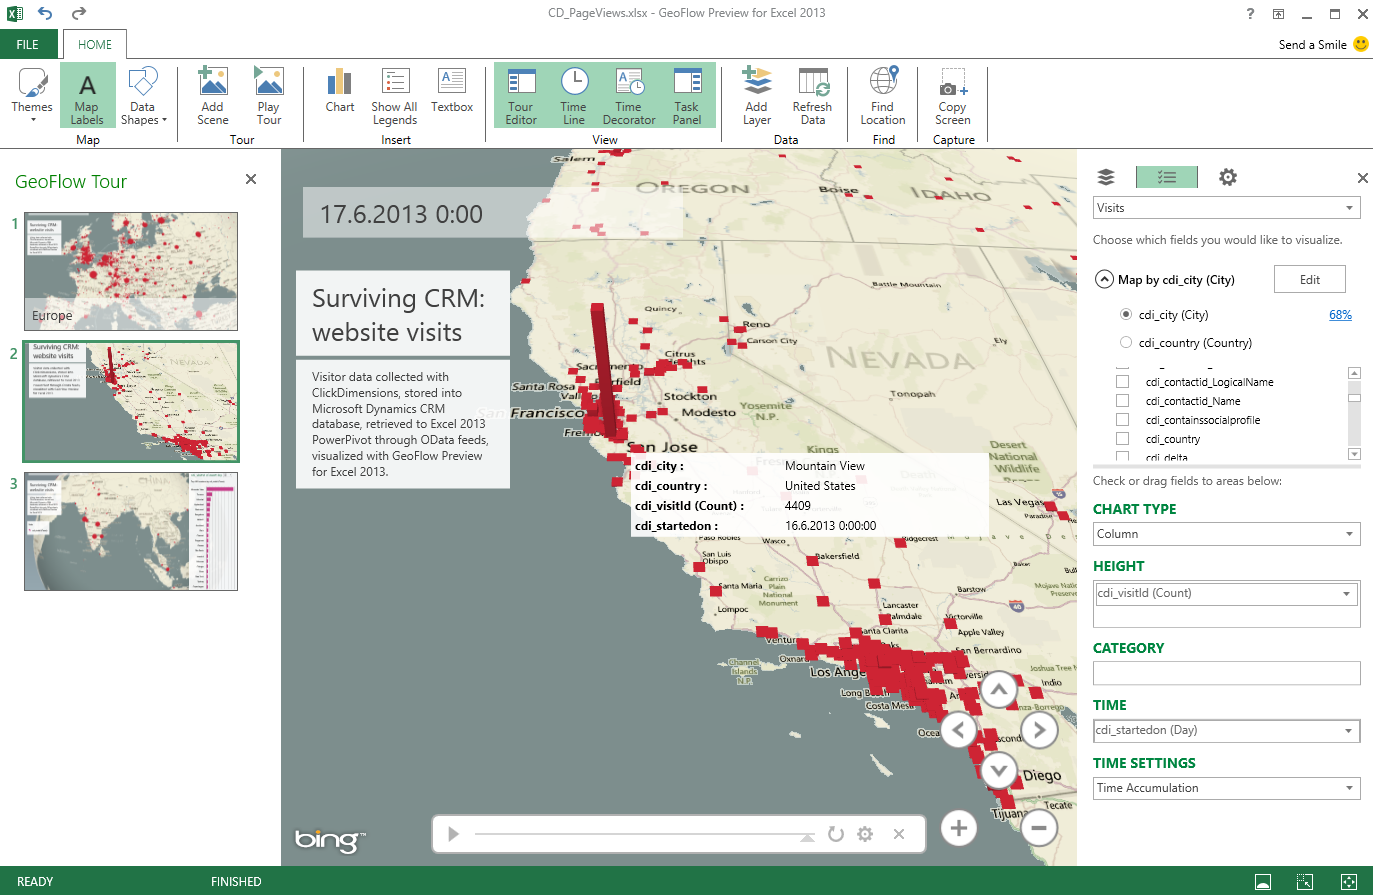
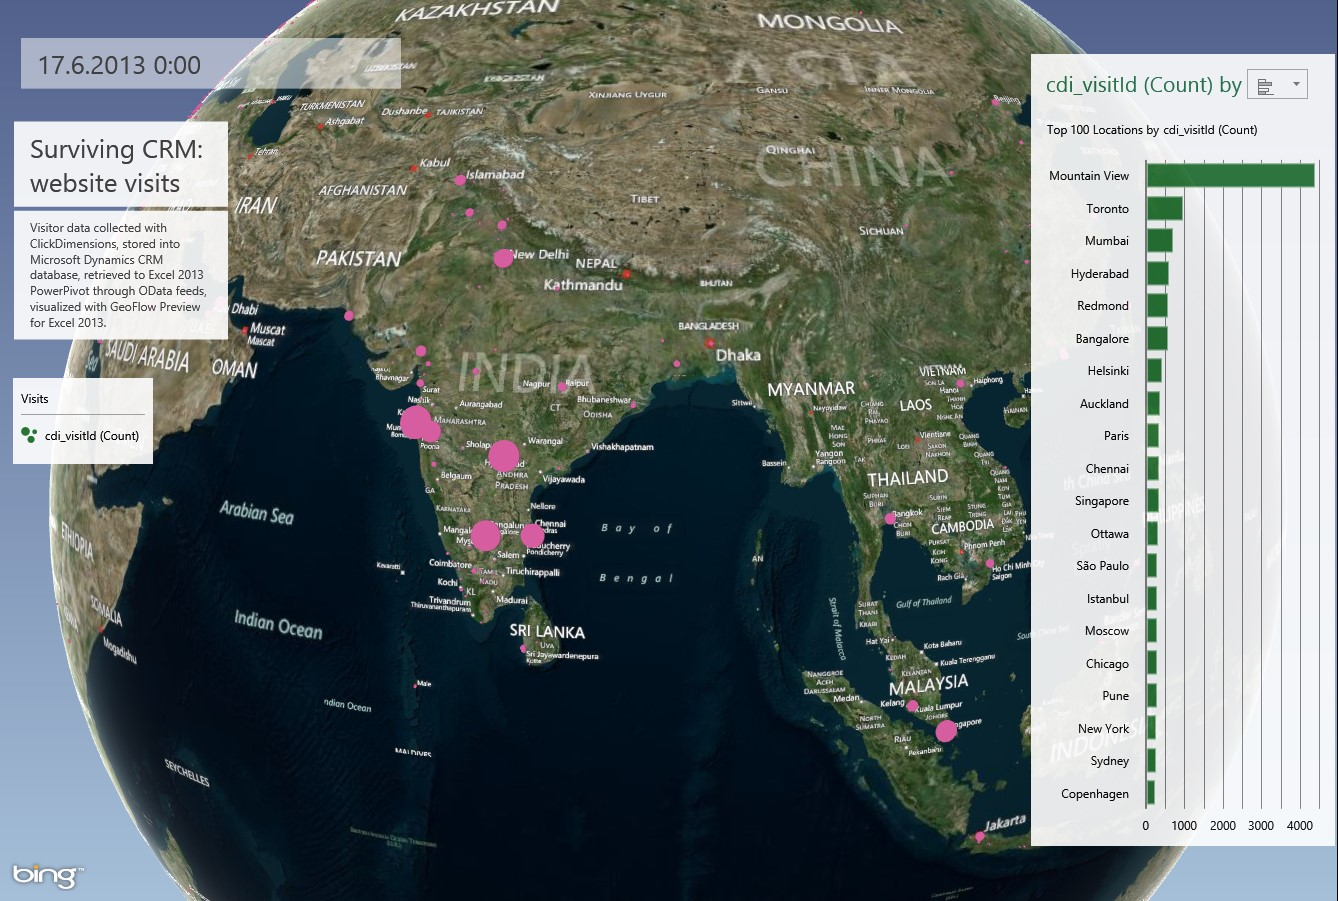
We can switch between city and country level mapping of the data once the fields have been identified, so next it’s time to define the other variables. I’ll choose the chart type to be column and drop the website visit entity’s GUID into the height field along with the count formula. Just like magic, my CRM immediately data jumps out from the map as red, square poles reaching for the stratosphere in a 3D visualization of the locations where my blog’s readers are from. Nice!
Naturally I can also zoom and pan around the globe to get a more detailed view of the data. I could display the data as a heatmap or bubbles, the latter which could be further broken down into tiny little pie charts with a category variable like “first visit yes/no”. Presenting a traditional chart alongside the map to illustrate the top cities visiting the site is also only a couple of clicks away.
Do you still remember the first time you saw those preview videos of SQL 2012 Power View bubble charts with a timeline component that moved the bubbles all around the canvas in a beautiful dance and made all us MSFT geeks go “oooooh”? Yeah, animation of data is the next step up from mere visualization of data and GeoFlow’s also got this aspect covered already in the Preview stage. You can select a variable that determines the time component of your data series, then decide how you want the data to behave (instant, time accumulation, persist the last) and press play to watch the data come alive on the map.
For presentation purposes you can create your own GeoFlow Tour that consists of different scenes and transitions. I decided to build a few website visitor scenes from different parts of the globe and combine them into a tour around the cities of the world where Dynamics CRM appears to be a hot topic. The end result can be seen the video below:
All we needed to make this happen was Microsoft Dynamics CRM, ClickDimensions and Excel 2013 (oh, and Movie Maker, too). Quite a powerful combination for supporting such a self-service BI scenario, even if you have to know a few hoops to jump through initially. Do also remember to read the Power View post on the Dynamics CRM Team Blog for more information on how you can work with CRM data in Excel 2013.
See that big red dot on the left hand side of the YouTube video preview still image? That must be the MSFT crowd from Mountain View who are partially responsible for making these tools available to us. My greetings to anyone reading this particular post from there is: “Great job on building the apps! Now, if only PowerPivot and Power View were available on a wider set of Office editions we could more easily push these tools as the solution for Dynamics CRM customers for taking their data analysis capabilities onto another level. Thanks.”
– End of transmission from planet CRM –


Carlsberg don’t do CRM blogs…but if they did
Keep up the great work
[…] Dynamics CRM Data Visualization with Excel 2013 GeoFlow | Surviving CRM […]
A small update: GeoFlow has now been renamed as “Power Map” and is being bundled into the “Power BI” product set that Microsoft is marketing as a self-service BI kit for Office 365 customers: http://office.microsoft.com/en-us/excel/power-bi-FX104080667.aspx
Thanks for the tutorial. Do you know of a way to bring over a pick list field text values?
Jukka:
Great tutorial…but I can’t get the OData service connected to a CRM Online instance. I followed the instructions to a T (at least I thought I did), and still get the same message “We can’t use the data from this feed…” Has something possibly changed with the updated BI pieces? The dynamic worksheet connects and updates just fine, so I’m stumped. Wrong connection string?
Scott
[…] Dynamics CRM Data Visualization with Excel 2013 GeoFlow | Surviving CRM […]
[…] CRM Online database and then published as an interactive report through SharePoint Online. See my previous blog post where I did just that (apart from the publishing […]
[…] two articles from Surviving CRM Blog gave me this idea on dealing with ta large set of data. (http://jukkaniiranen.com/sandbox/2013/06/dynamics-crm-data-visualization-with-geoflow/ and https://www.youtube.com/watch?v=1er6bu9nmlk […]