Related sites:
Newsletter: Perspectives on Power Platform
Company: Niiranen Advisory Oy
A few weeks ago I launched a demo survey built on Voice of the Customer, the brand new survey tool from Microsoft. The goals I had for this exercise were twofold: 1) see how these type of interactive tools could be used in live events like eXtremeCRM 2016 Warsaw, and 2) gain some experience on what it is actually like to work with incoming survey response data inside Dynamics CRM. In this post I’ll mainly be focusing on the latter one, although the example data we’ll be looking at are the live answers you & other readers of this blog submitted via the eXtreme MVP Survey.
As you may know, Voice of the Customer (or VoC as we’ll refer to it from now on) is a pure XRM solution. Although the actual customer facing survey forms are of course not presented via the Dynamics CRM client UI, everything that you use for configuring the survey questions and logic, as well as the incoming survey responses, is managed with CRM entities and stored into the CRM database. The reason this is such a big deal is that most of you will already possess the skills needed for leveraging such data via views, charts and dashboards as it’s just XRM all the way. Furthermore, you’re free to design business processes around the survey functionality with tools like real-time workflows or business rules. Naturally you’re also able to interact with the survey entities and records via the latest CRM Web API, should you come across some integration scenarios where data needs to either flow in or out to another system.
The flip side of this coin is that VoC is unfortunately very XRM-ish to work with. If you compared it to dedicated survey apps that do nothing but questionnaire design (like SurveyMonkey, Surveypal and the likes), survey publishing and response data analysis, then there’s still quite a big gap for Microsoft to work on bridging when it comes to the end user experience of this tool. In a way this is quite understandable since the value proposition of VoC really is all about the tight integration with your customer data and the ability to send survey invitations automatically as a part of your customer facing processes; such as a survey link being emailed to a customer after a support case is closed in CRM, to gather quick ratings and design automatic escalation paths if the KPI’s are not met. Nevertheless, since VoC does also support creating pretty advanced surveys for collecting quantitative data from a broad target group in more traditional campaign style satisfaction surveys, as well as anonymous survey links presented on website, it’s good to understand what it’s like analyzing such data inside Dynamics CRM.
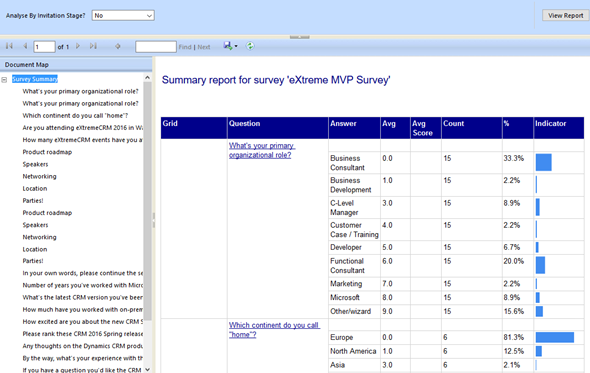
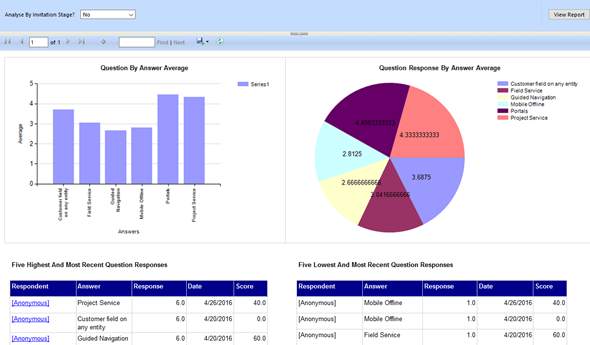
There are a lot of components in the VoC solution right out of the box. First off, there are four SSRS reports: Survey Summary, Question Summary, Net Promoter Score and Survey Export. The first two are general purpose reports with tables and charts summarizing the data either across a single survey or a specific question, as illustrated in the screenshots shown here. The NPS report is naturally aimed for this particular survey type, whereas the export one is a single huge matrix for dumping out the raw survey response data into Excel for further manipulation.
For more interactive data analysis there are eight dashboards in the VoC solution. However, these may not be all that useful for many real life scenarios, since they suffer from the same limitation as all Dynamics CRM dashboards: there are no global filters you can apply for all the dashboard components. Meaning, unlike with an SSRS report launched from CRM, you can’t set the context of the dashboard to be a specific survey. Yes, with the new “interactive experience dashboards” introduced in CRM 2016 you do get this type of filters, but since right now those features are limited to the Interactive Service Hub only (which in turn has a fair number of limitations for general use), it’s not exactly the kind of solution we’d need right here.
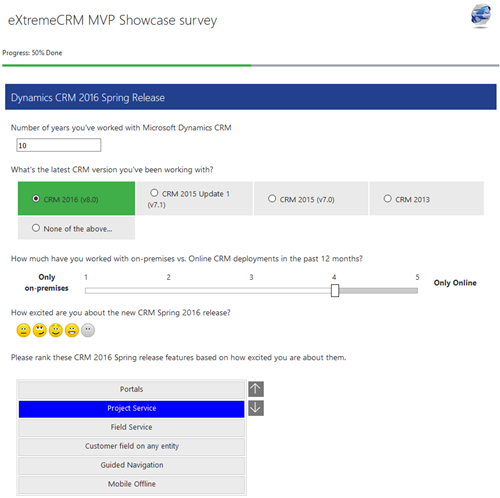
That doesn’t mean we couldn’t build pretty dashboards to summarize our survey responses, though. I had a go at this with the eXtreme MVP Survey and it turned out pretty well. Have a look (click for a larger image):
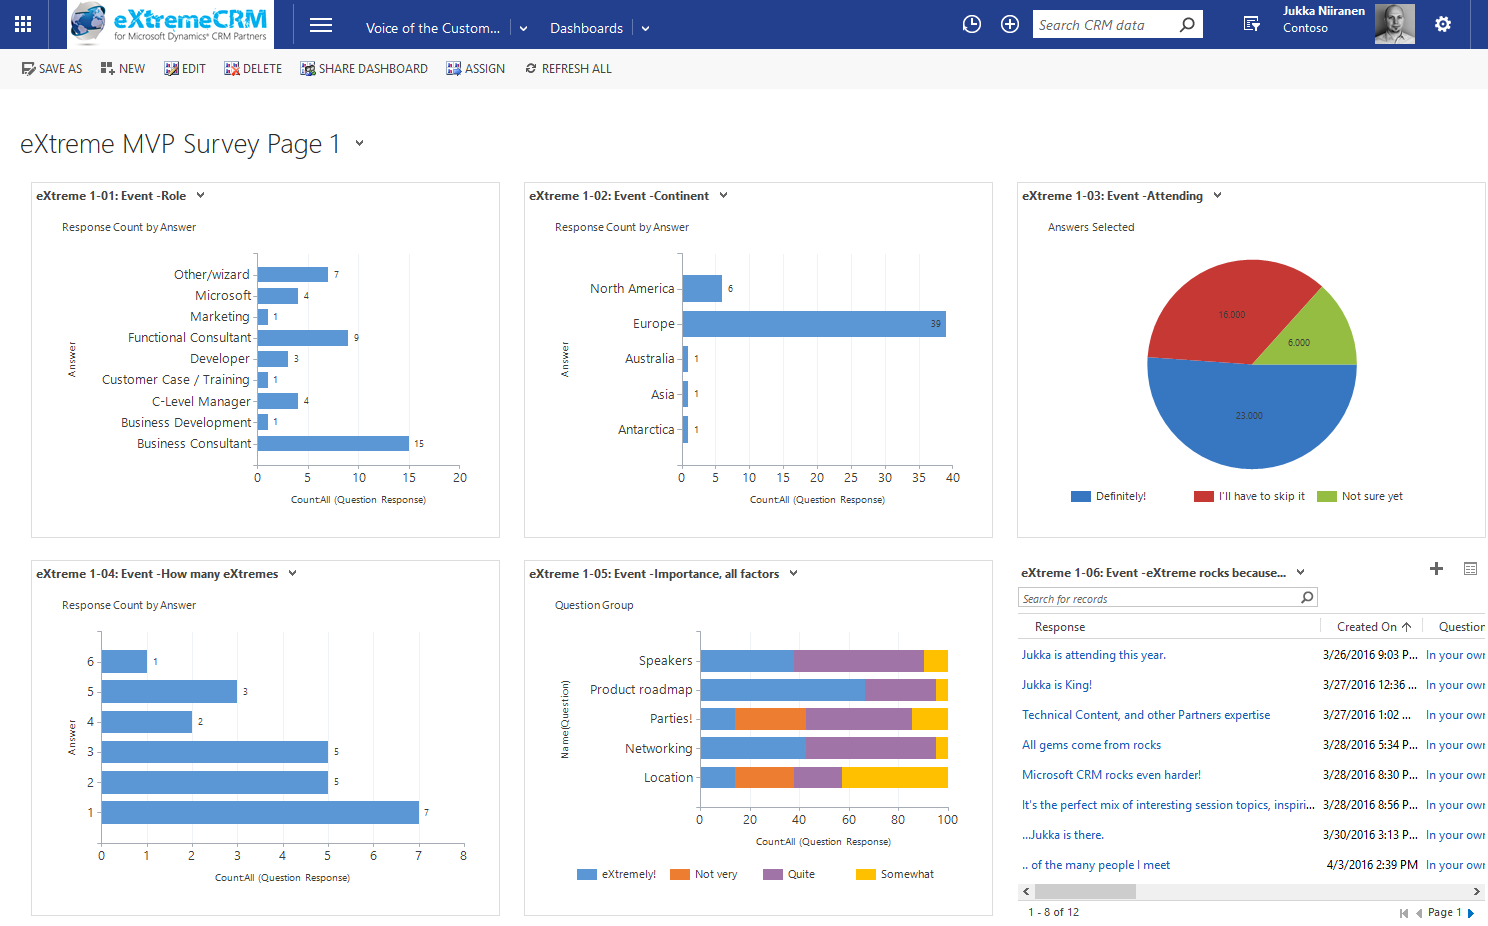
In the survey form I had three pages full of questions and I constructed the corresponding pages as personal CRM dashboards. This allowed me to both monitor the incoming responses during the survey data collection period as well as present the results to the audience at the MVP Showcase session in eXtremeCRM. It looks good, it appears very familiar to existing CRM users and it gets the job done without having to resort to any complex report development.
What it does require, however, is a fair bit of customization work and lots and lots of clicking to build all of it. First of all, since we don’t have very usable interactive filers in traditional CRM dashboards to specify what question we want to summarize in a single chart, I had to create a specific saved view for each and every question. While this may not be too difficult a task for a CRM power user, the first thing many will likely struggle with is “where do I even find the response data?”
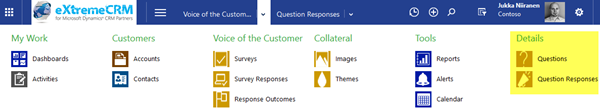
The VoC solution adds a new section into the CRM Nav Bar, but unlike some of the other preferred vendor solutions, it’s fairly sparse in terms of content. Being one of the self-proclaimed CRM UX thought leaders out there, I do appreciate the fact that all the entities of this solution haven’t just been thrown out there into the Sitemap to confuse the users. In the role of a survey administrator who needs to extensively work with the data, I found this a bit too limiting, so I went and added a couple of additional icons into the sitemap: Questions and Question Responses (an easy task to accomplish with XrmToolBox Sitemap Editor). This helped me immensely in navigating the survey data model and, most importantly, add the new views and charts that I needed for my analysis efforts.
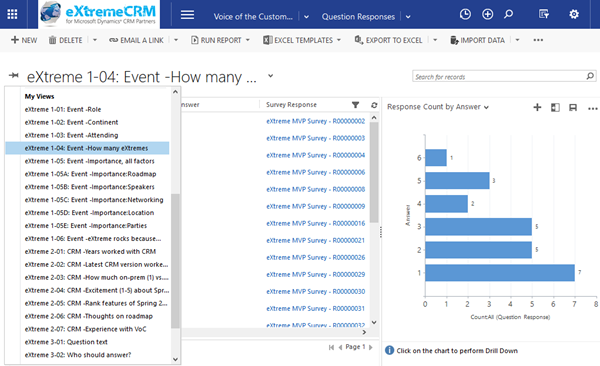
To summarize the VoC terminology, Surveys are where you do much of the configuration work and Questions is what you include into your survey pages to gather data. Survey Responses are created for each submission of a filled survey form and they contain a set of Question Responses that – you guessed it – represent an individual response to a question, given by the respondent. There are 18 other entities inside the VoC solution to manage various parts of the application functionality (such as Response Routing to manage conditional display of questions), but for now we just need to understand that it’s the question responses we really want to visualize on our dashboards.
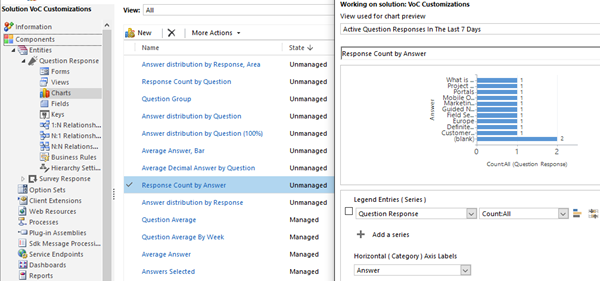
There are a few OoB charts for the question response entity, but I ended up needing to create several more in order to present the results of my survey in a sensible format, so be prepared to do the same. As with any reporting and analysis work in your average CRM project, you’re never really going to know how you want the data to be presented until you have some actual data in the system. It takes a lot of hit & miss experimentation to see what type of chart and grouping options make sense for a particular type of a survey question – unless you’re CRM Chart Guy, whose CRM Chart Editor and XML reference articles will surely come in handy when trying to tweak the data presentation to your liking.
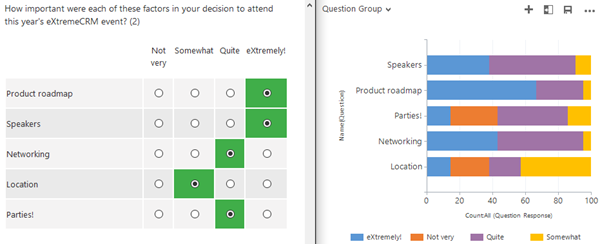
The great thing about VoC is that the survey designers allows you to use a wealth of different question types that you’d expect to see in modern web survey forms. While all of this data will be stored into CRM on a very granular level, figuring out how to present the results as a summary can be a tough job. For example, the question group type where you ask the customer to rate a group of different attributes under the same question of a scale from 1 to X isn’t the easiest to map out in a CRM chart. I ended up building it as a 100% stacked bar chart that has two categories for Question and Answer names. It turned out pretty much like I wanted it to, but if you look more closely into the chart you’ll see that the order of the answers is different that how they’d be logically presented in the survey form. So, prepare for either some compromises or long nights trying to master the ASP.Net chart XML used by Dynamics CRM.
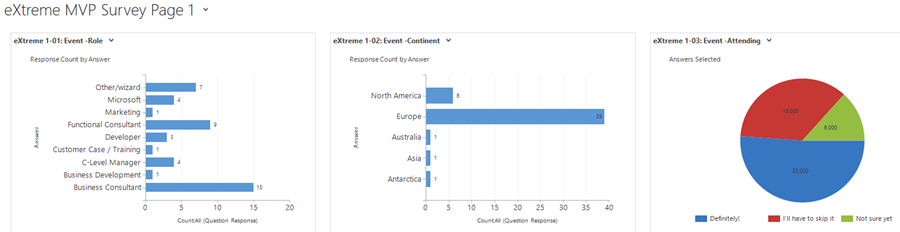
After building the saved views for each individual question and testing the answer data with the custom charts I had added for the Question Response entity, I was then able to put all of this together in a dashboard. Since our survey contained more questions than you can fit components into a single CRM dashboard (which is six, at least of you’re on Online), I needed to break the results down into three different survey result pages. Here’s page 2 of the survey that focused on the Dynamics CRM application and the upcoming Spring 2016 release new features (again, click for a larger pic):
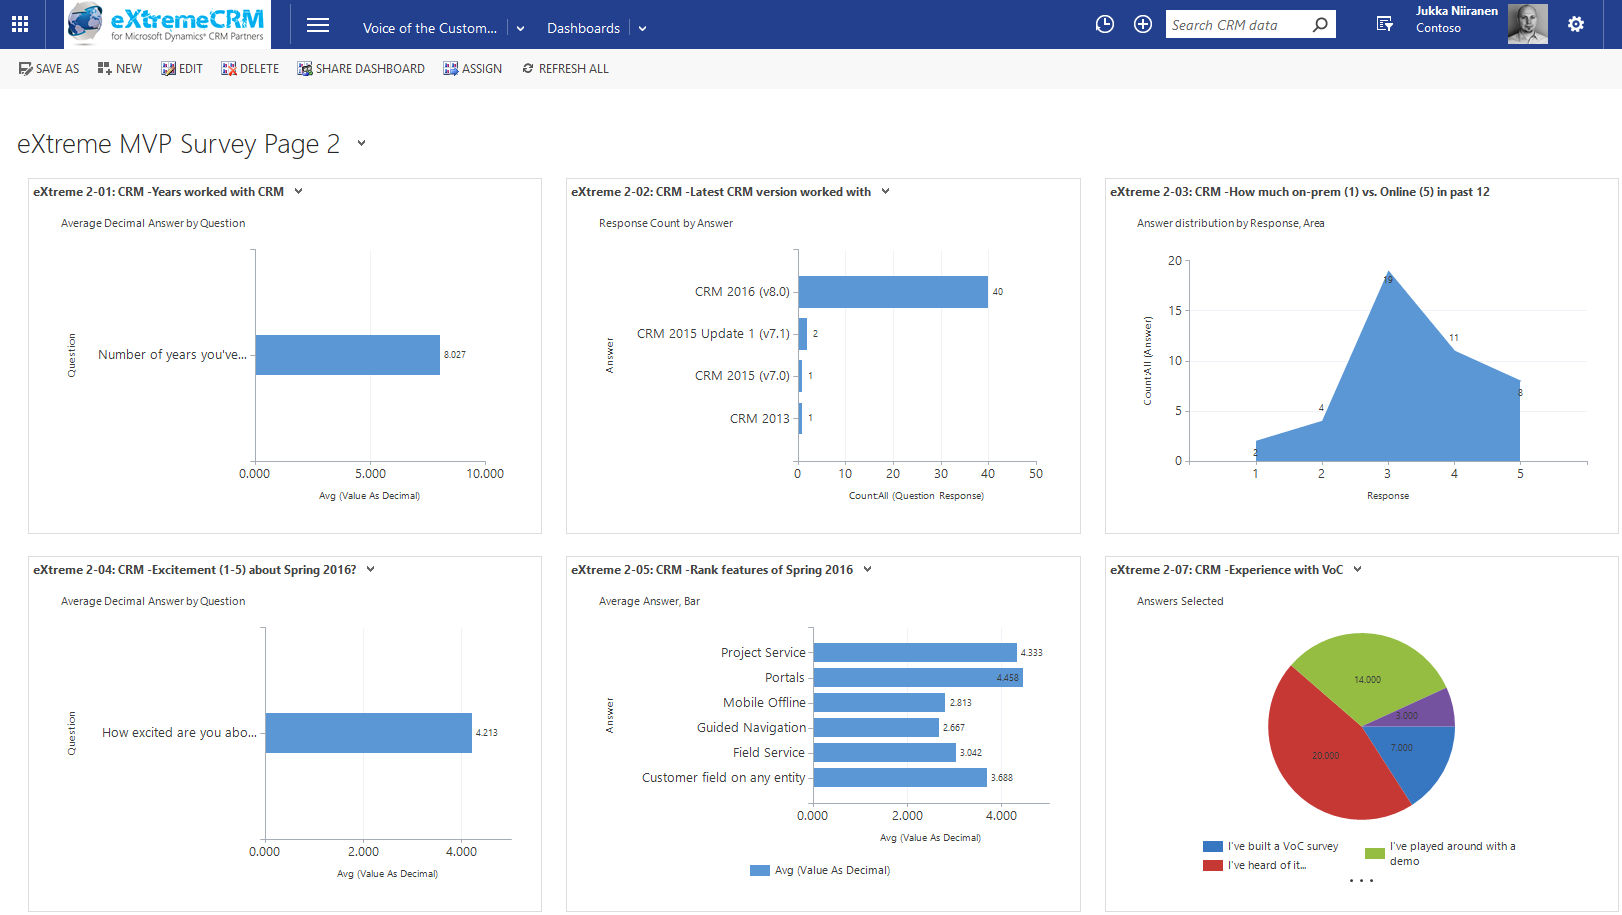
What can we learn from the data then? Starting with the experience of the respondents, they had been working with Dynamics CRM for a whoppin’ 8 years on average (meaning from the CRM 4.0 if we look at the history of the platform). They weren’t stuck in the past, though, since pretty much everyone had already worked on the latest v8.0 / CRM 2016 version. For the question “How much have you worked with on-premises vs. Online CRM deployments in the past 12 months?”, a mixture of working evenly across both deployment types was the most common option, but “Online only” was definitely a more popular option that “on-prem only”.
The level of excitement for the new CRM 2016 Spring release on a scale of 1-5 was 4.2, which sounds to me like quite a high score (especially if it’s interpreted as a European “I’m excited!” statement rather than the US counterpart that may not be quite as strong a currency). When asked about the what the most exciting new feature in v8.1 is, it was a close call between Portals and Project Service, whereas Guided Navigation (a.k.a. Learning Paths) and Mobile Offline weren’t seen quite as revolutionary advancements in the Dynamics CRM product. Finally, when asked about the experience on using Voice of the Customer, almost half of the respondents had either built an actual survey already or at least played around with a demo environment containing VoC.
Due to the fact that we were running the eXtreme MVP Survey as allowing anonymous responses via a public survey link, there wasn’t any other data apart from the actual survey responses that could have been combined into the results analysis. In a real life scenario where the VoC survey invitation links are sent from the live CRM system containing all your customer profile data as well as details like past transactions, the possibilities for drilling deeper into the results are of course where the real value of VoC comes to life. Being able to compare the NPS scores and other survey response metrics with the past purchases, support incidents or any other interactions that the respondents have had with your company is a potential goldmine of data for taking the customer experience to the next level.
For these types of analysis you’d probably want to explore the options for crunching the numbers in a more advanced reporting tool like Power BI. This was initially also what I had in mind for this demo scenario, but unfortunately due to the bug in current VoC solution that breaks the CRM Online OData feeds, I had to leave that exercise for a later date. Anyway, all the response data that VoC collects is still available in the CRM database, so pretty much any BI tool that can talk with Dynamics CRM can benefit from the detailed survey data that can be linked right under the customer records.